If a question asks for data presentation it wants you to talk about the graphs we drew from the data.
You need to know what the name of the graph was, why we picked it and any limitations of the data presentation technique.
You need to know what the name of the graph was, why we picked it and any limitations of the data presentation technique.
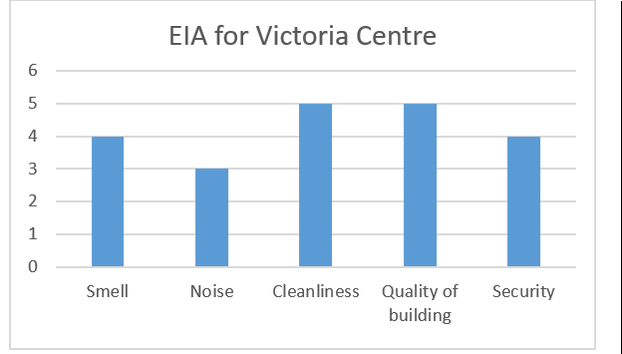
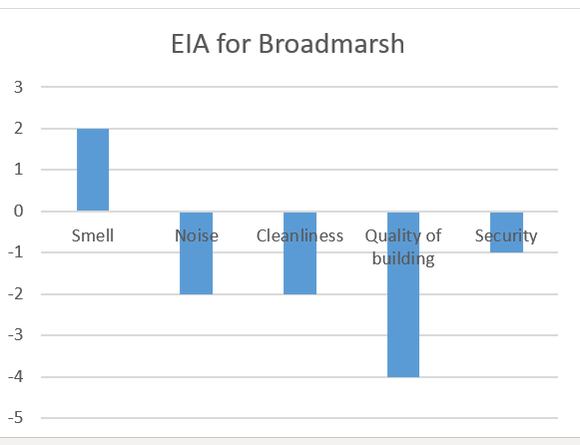
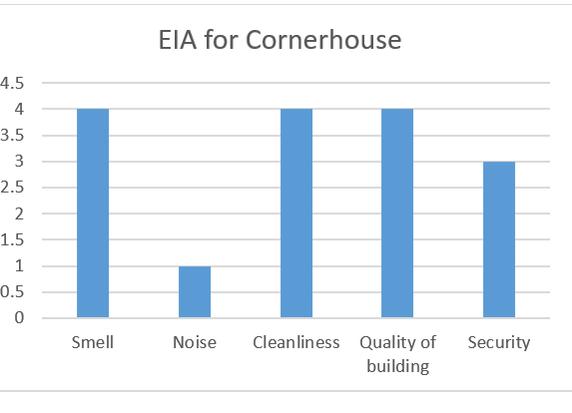
EIA
An bar chart for each site was used to show this data
|
|
|
Reason |
Limitations or Alternatives |
Keeping the bar graphs separate enabled a clear pattern to be shown for individual sites It is possible to present positive and negative data on bar charts The data is non-continuous /discrete |
As they are not all on the same graph, it is harder to spot patterns between the sites |
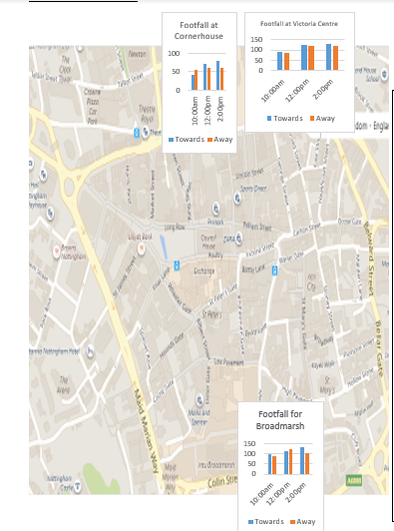
Footfall
|
We chose located bar charts to present this data
|
|
Reason |
Limitation or Alternatives |
The data is non-continuous / discrete Each bar is placed on the site the data was collected and the time noted It allows to identify areas of the city which receive more and less visitors Flow lines can be added to examine the direction shoppers travel around the CBD |
Due to the distance between the sites, the bar charts have to be made quite small to fit on which limits the ease at which you can accurately read data from them. The bar charts also had to be made different sizes which limits the ease at which you can compare the charts and look for overall patterns |
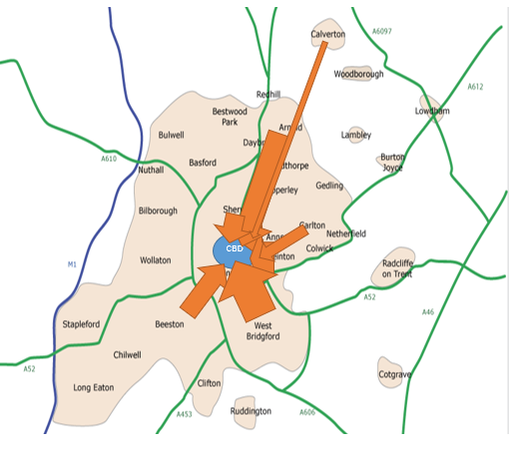
Questionnaire: Where are you from?
|
We displayed this data using flow lines. These are lines of differing thickness to demonstrate different numerical values - the thicker the line, the more people came from that location.
|
|
Reason |
Limitations and Alternatives |
Flow lines are drawn from the origin of the shopper to the CBD These lines are proportional – they are wider for areas from which more shoppers travelled. It allows us to identify how far shoppers travel and whether there are any particular areas of the city which more shoppers travel from. |
The flowlines obliterate some of the destinations which makes the map very hard to read. You cannot read specific numerical data from this - you can just use terms that describe relative importance such as, 'the area most people came from was West Bridgford' |
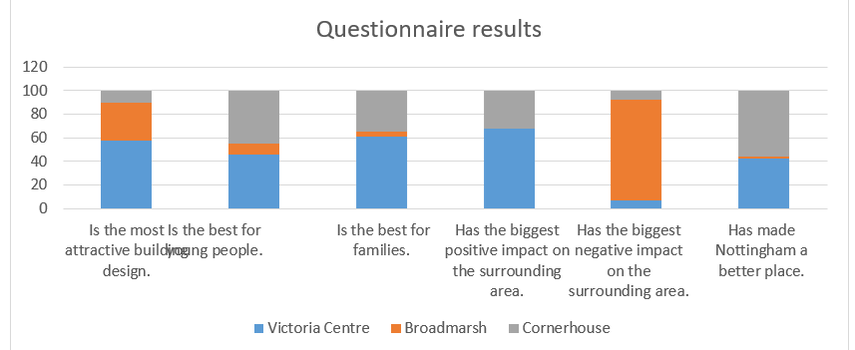
Questionnaire: Views on regeneration
|
We displayed this data in a compound bar chart
|
|
Reason |
Limitations and Alternative |
This data is non-continuous / discrete The total responses per question add to 100% Clearly identify which sites best fit the descriptor and identify which areas are more successful - comparison is easy to do. |
To quote specific numbers of respondents from the Broadmarsh and Cornerhouse data sets, you need to do some maths which might not be possible for some people. |
