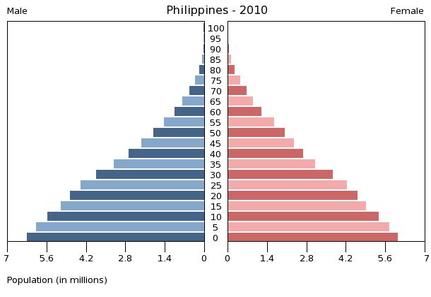
- The base shows the birth rate. The wider it is, the higher the birth rate.
- The death rate is shown by how quickly the pyramid gets thinner as it goes up. If it thins quickly, that implies not everyone survives until the next age band.
- If it gets thin between the first two age categories that shows that there is a high infant mortality (which means ‘child death’). This is because not all children survive until the age of 5.
- The life expectancy is shown by how high the pyramid is. If it’s not that tall, people don’t tend to live to an old age.
- People of a working age (between 16 and 65) are called economically active because they work and help the economy. The more there are of these, the more likely it is to be an MEDC.
- People below this working age are called young dependents. These cost the government money instead (in education, healthcare etc)
- People above this working age are called old dependents. These cost the government money (in pensions, retirement homes, healthcare etc)
|
|
Dependency Ratio
|
You may be asked to work out a dependency ratio. I doubt they would ask you to do everything from scratch - they would more likely give you the answer to 5 and 8 and then you would need to do steps 9 and 10.
Have a go at this one: 1.How many males are there who are younger than 14? 2. How many females are there who are younger than 14? 3. How many males are there who are older than 65? 4. How many females are there who are older than 65? 5. Add the answer to 1-4 up 6. How many males are aged 15-64? 7. How many females are aged 15- 64? 8. Add the answers from 6 and 7 up 9. Divide the answer to 5 by the answer to 8 10. Times by 100! |
